The Need to Look at the Entire Disciplinary Code of Conduct and a Visual Way to Do It
The use of exclusionary forms of school discipline, in particular suspensions, continues to be at the forefront of education policy debates. A wide body of evidence shows that suspensions are predictive of undesirable student outcomes – lower academic performance, higher dropout, and increased criminal justice involvement. Furthermore, the use of suspensions disproportionately impacts students of color.
Such evidence has led many states and school districts to implement discipline reform over the last several years, many aimed at reducing the use of suspensions through bans or limits on their use.
The need to look beyond suspensions
In my view, the evidence that suspensions harm students is clear. That said, a sole focus on reforming discipline through a narrow focus on suspension is likely wrongheaded and, when done without proper supports or trainings, may be a recipe for negative unintended consequences as some studies are suggesting.
The reason for this is that school discipline is much more than suspensions. Discipline begins at the classroom level with the myriad of ways that teachers approach classroom management. Even when misconduct necessitates a response from an administrator, schools have many options available at their disposal (detentions, in-school suspension, counseling, parent conferences, etc.) and much discretion in how to administer them.
Much of the research on school discipline to date, however, has overlooked the full picture of a school’s approach to discipline.
Data visualizations as a way to see codes of conduct
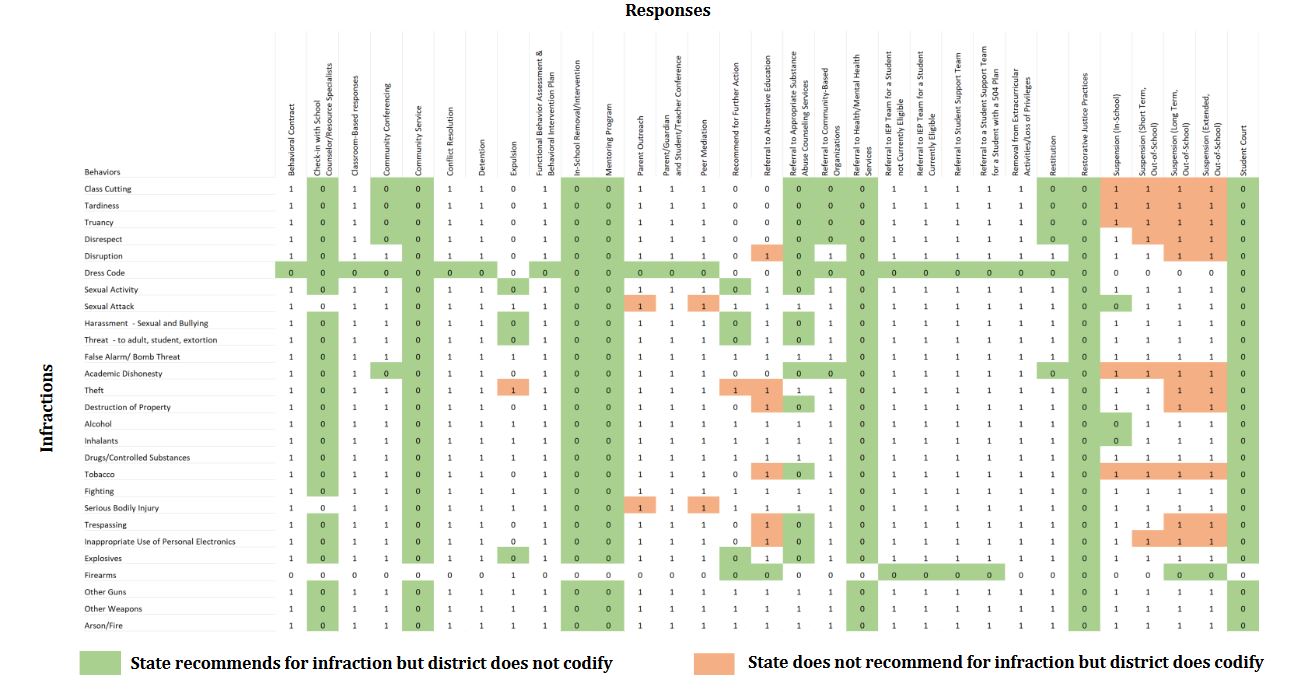
One reason for this may be that succinctly capturing a school’s overall approach to discipline is difficult. For instance, in Maryland, the state guidelines for district codes of conduct define 27 infractions and 31 responses, resulting in over 800 infraction-response combinations.
This large number of infraction-response combinations is then detailed in what typically amounts to pages of text and tables in local codes of conduct, making comparison of school discipline approaches across districts difficult to achieve.
Data visualizations, however, may offer a solution.
Recently, Dr. Maida Finch of Salisbury University and I released a report in which we distilled each of Maryland’s school districts’ codes of conduct into a single visualization. Each is color coded to show alignment or misalignment with state recommendations.
As seen in the example below, we show places of alignment with the state recommendations in white. Areas where the local district recommends a response for a given infraction when the state does not are in orange. Areas where the local district does not recommend a response for a given infraction when the state does are in green.
The visualizations allow for quick comparisons of disciplinary approaches across districts and to state recommendations.
We find that there is a great deal of local variation in school districts’ codes of conduct. As shown, some districts are almost perfectly aligned with the state (white) while others codify far fewer or, in some cases, more recommended responses than the state.
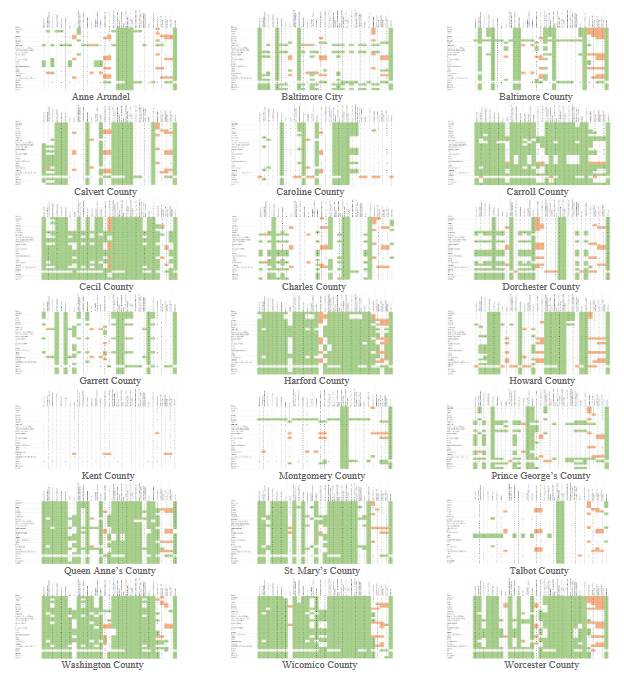
While we do not find clear patterns between the degree of alignment with state recommendations and overall rates of suspension or racial disparities in discipline, the visualizations nevertheless offer a uniform and efficient way to begin dialogue around the full range of a district’s response to student misconduct.
Useful for policymakers and practitioners
We have had the opportunity to present these visualizations to a task force on school discipline chaired by members of the state board of education, to school administrators working on the front lines, and to the state advisory committee to the US Commission on Civil Rights.
Overwhelming, the response has been positive. The visualizations offer a clear way for those working at high levels of governance and even those on the front lines implementing their own district’s code of conduct to see trends in their approach to discipline and to compare to the practices of other districts.
While descriptive in nature, this work shows the promise of applying new visualization approaches to expand our understanding of school discipline and to facilitate more meaningful conversations around reforming school discipline.
The full report can be found here.